Reaction Time Lab

justin reaction time lab

The objective was to use g (the acceleration due to gravity) to be determine my reaction time and motor nerve conduction speed.

my materials i used was a ruler

The procedure was to start at 0 mm. on the ruler where i held my two fingers ready to catch the ruler. Then have my partner drop the ruler for me to catch, recording my reaction time, and then i would do the same for my partner. I was to record five individual trials to find my average time and my partner did the same to. i used the the equation ( d = (1/2gt*2)) and (g = 9.81 m/s*2)). since we were solving for the time i had to use another equation, (t = sqrt(2d/g)). then i had to convert all my times found into meters. I plugged each distance into the equation to calculate time and then to find the average of my five trials. That was my reaction time.

my analysis: my average time was .2 meters per second, and my motor nerve reaction speed was 4.55 meters per second.

Hot Wheels Acceleration Lab

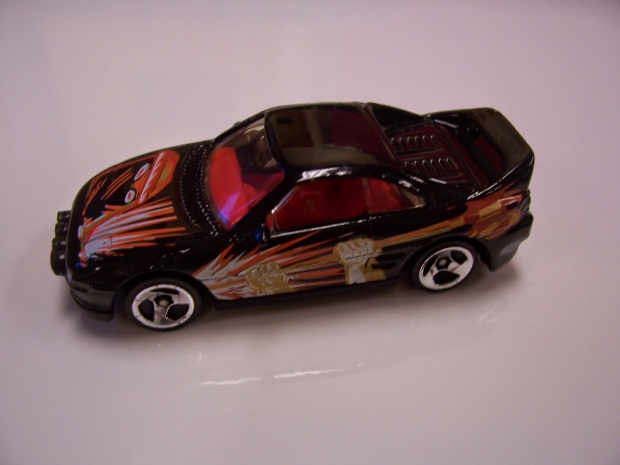
The objective in this lab was to calculate the acceleration of my Hot Wheels car.

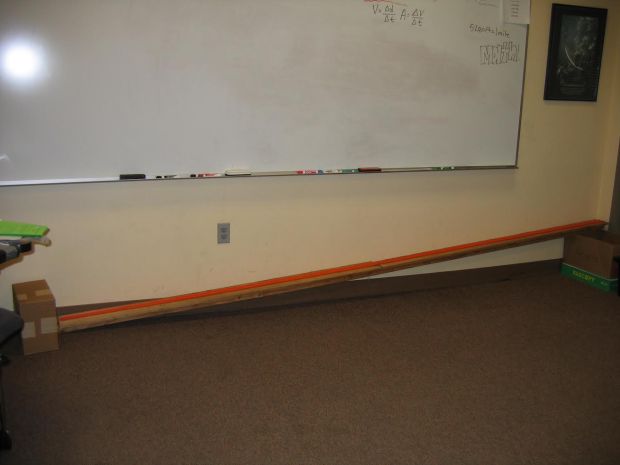
The procedure was to have 2 friends position my car at five and ten feet along the ten foot long track with stop watches. I was to send my car down the track. Not push it. Just let go and let gravity do the work. Everybody will start their stopwatch as the car is released. As my car passes each friend, they should stop their watch and record it in the table one.

My car traveled 2.26 seconds at 5 feet on average, and 3.35 seconds on average at 10 feet. With 5 feet intervals of 2.26 seconds and 1.09 seconds in order. My cars average velocity was 2.21 at 0-5 feet, and 3.14 at 5-10 feet. By using the equation v=d/t to find my average velocity.

My instantaneous velocity at 5 feet was 4.42, and at 10 feet it was 5.96.

My acceleration at 0-5 feet was 1.95, at 5-10 feet it was 1.41, and at 0-10 feet it was 1.77.

I would expect their acceleration to be the same because of the constant velocity.

the acceleration at 0-10 feet in miles per hour was 1.2 mph. And on a 1/64 scale, it is 76.8 mph/s. it would take my car .78125 seconds to get form 0 to 60 mph.

It was a fun experiment and I think I completely understand the way acceleration and velocity works.
hot wheels acceleration lab

How Fast Is Your Hot Wheels Car?

hot wheels lab

We took our cars from the hot wheels lab and 40 feet of track, with stop watches. We individually put our cars on the track with four markers. One at ten feet, one at twenty, one at thirty, and one at forty. At the ten foot marker, it was pretty level, starting to get steeper into the twenty marker, where the slope was pretty steep going into the drop at the thirty feet marker and then leveling out into the forty foot marker.

unnamed

Speed and Velocity Quiz

  • Speed

You need a distance and a time.

There are different ways to tell speed.

Mph, Mps, Kmps, Miles per hour, meters per second, kilometers per second.

  • Instantaneous Speed

it is how fast it can go in an instant

  • Average Speed

take two speed, find the middle of it and thats your average.

  • Velocity

speed + direction

the speed can change according to the direction

  • Constant Velocity

a velocity that doesnt change.

stays the same, same speed.

  • Changing Velocity

a velocity that changes.

changes the speed.

is very unpredictable.

Hot Wheels Scientific Method Lab

100_3797
The objective of the “Hot Wheels Scientific Method Lab”, was to  show understanding of the scientific method by designing a lab sheet for the following experiment, completing the experiment, then analyzing the data and reporting on the lab. I was to design a lab sheet with the following headings to use for the following experiment.

Problem/Question

Hypothesis

Independent and Dependent Variables

Procedure

Data

Analysis

Conclusion

Making sure to include a detailed procedure and tables to record my data in.

          The question to the lab was to find out which surface the hot wheels race car went the furthest on. Wood, carpet, or sand paper. There would be three trials, and three different ramps, all at the same height and length. My hypothesis was that my car would go the furthest on the sand paper surface.

          The independent and dependent variables were the surface as the independent and the distance was the dependent. The constants were as follows; surface and the car, where the car starts, height of the ramp, distance ramp is from the ground, and where the track is placed.

          The procedure; I was going to measure the distance the ramp is from the ground, make sure to record where the car starts down the ramp, and place the ramp in the correct position. I recorded three trials, all starting the car at different heights on the ramp. Then I recorded my results when all three trials were completed.

          This is my data table:

Carpet Sand Paper Wood
Trial 1 2 yards 2 yards 30 in. 2 yards 14 in.
Trial 2 1 yard 27 in. 2 yards 2 yards 20 in.
Trial 3 1 yard 32 in. 1 yard 34 in. 1 yard 28 in.

100_4139 My analysis was that the car went the furthest on the sand paper when starting at the highest point (1st arrow).

The distance the car went on the wood was affected by the way it made the car twist and turn. No other inferences were recorded.

My conclusion was that the experiment was to find out how far my car went on different surfaces. I recorded 3 trials for the procedure; each trial was at a different height on the ramp. All with different surfaces. My hypothesis was that my car would go the furthest on the sand paper surface. There was carpet, sand paper, and wood to test my car on the distance. I found that my car went the furthest on sand paper; recording it at 2 yards and 30 inches. When it was dropped at the highest point of the ramp. On carpet; 2 yards even. And on wood; 2 yards and 14 inches.

Scientific Method Quiz

Problem to solve – What needs to be solved.

Research – Find more information on the problem, that is helpful to solution.

Hypothesis – An educated guess on the problem. What you think is going to happen.

Experiment – Independent and dependent variables, creating an experiment on the problem to help solution.

Collect and analyze data – Collect the data from the experiment and analyze it according to hypothesis.

Conclusion – Figure out whether or not hypothesis was correct and what you learned from experiment.

Publish – Tell everybody what you learned when completing said experiment.